4 Types of Data Analytics: How Businesses Can Use Them
In a world dominated by technology and digital business practices, companies have access to vast amounts of generated data from various sources. Yet, the true potential lies in the ability to interpret this data effectively. How can one pinpoint valuable information from a huge clutter? This is where the data analytics shows its importance.
Data analytics is the process of converting raw data into practical insights that drive business growth. What’s even more exciting is that there are four types of data analytics, each crafted to answer specific queries and empower you to make well-informed conclusions based on your data.
Let’s delve into key types of data analytics and explore how they can bring significant benefits to your team.
Data analytics is vital for business success, driving revenue, and enhancing customer experiences. The core of data analytics comprises four pivotal pillars: descriptive, diagnostic, predictive, and prescriptive analytics. Additionally, some data analytics specialists indicate along with the four types of analysis a fifth one, called cognitive analytics. However, it still has a huge room for improvement and is not as widely adopted as all the others.

Main types of data analytics
So, let’s dive into the topic and describe the different data analytics types one by one.
Descriptive analytics
This type of data analysis explains what occurred, often using multiple data sources. Let’s imagine a hospital. It would employ descriptive analytics to review historical data on patient admissions, departmental activity, and resource utilization. This analysis provides insights into which departments are consistently busier, peak admission times, and the general flow of patients.
While descriptive analytics answers the question “What happened?” and is a great tool for summarization and data visualization, it still requires a combination with other types of analytics for better insights and outcomes.
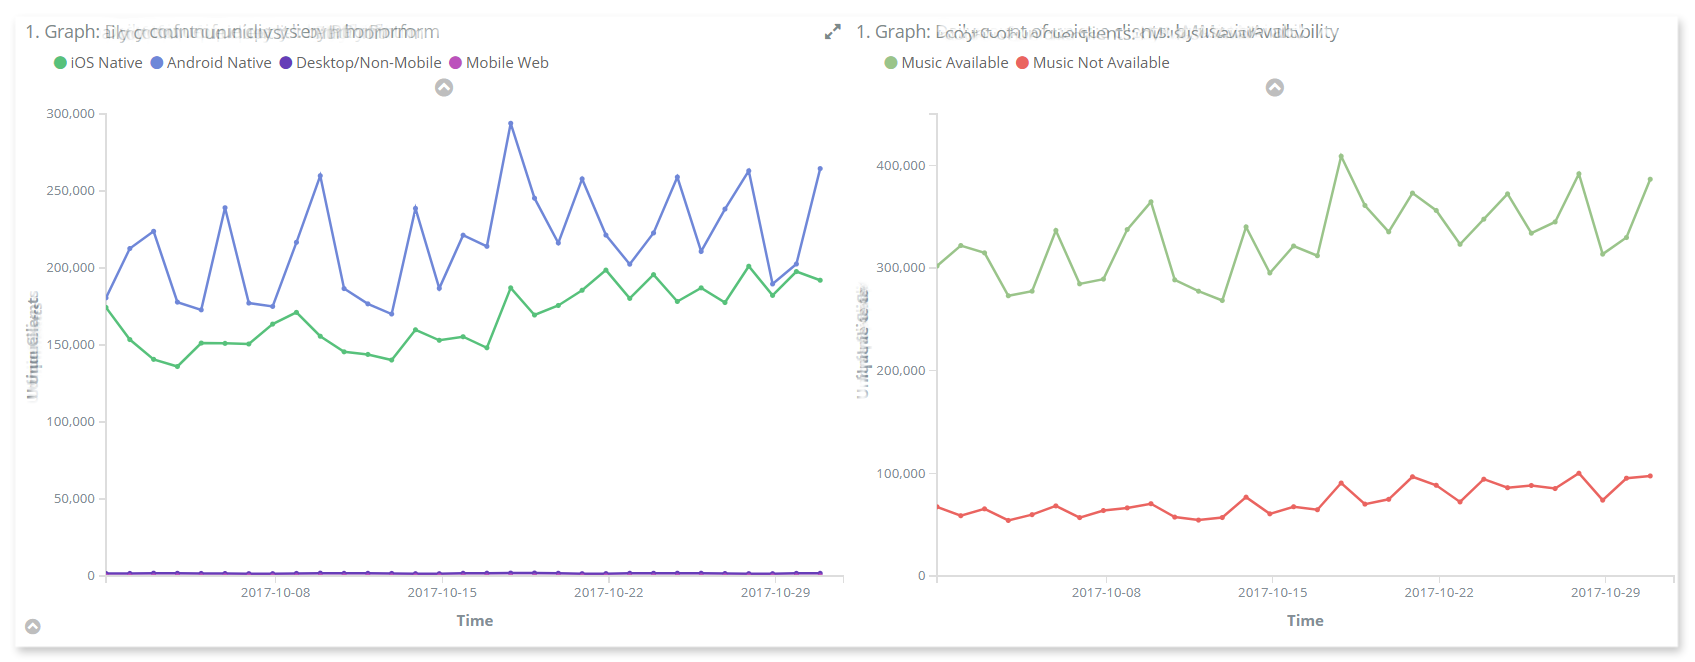
Example: Data insights on media playback on various devices
Here are a few common examples of the use of data analytics of this type:
- Sales performance. Sales managers track when daily sales exceed a specific amount or see how many units each employee sold this month.
- Dashboard reporting. eCommerce companies use dashboards for real-time updates on page views, unique visitors, and user sessions across their global properties.
- Fraud detection. Banks or other financial institutions continuously monitor transactions for any suspicious activity that could indicate credit card fraud.
- Product demand analysis. Retailers analyze past sales data to predict how much inventory their business will need for upcoming periods.
Diagnostic analytics
Diagnostic analytics compares historical data to understand why the events happened. The goal is to uncover dependencies and patterns within past information related to a specific issue. This approach to data collection removes the need to gather fresh data for each problem, saving time and money.
Continuing our example with the hospital, it would use diagnostic analytics to research the reasons for patient admissions and readmissions, using statistical analysis and data visualization to identify commonalities among them. This could uncover, for instance, that patients with a certain chronic condition are more likely to be readmitted to the hospital.
Diagnostic analytics answers the question “Why did it happen?” and assists in troubleshooting issues or challenges.
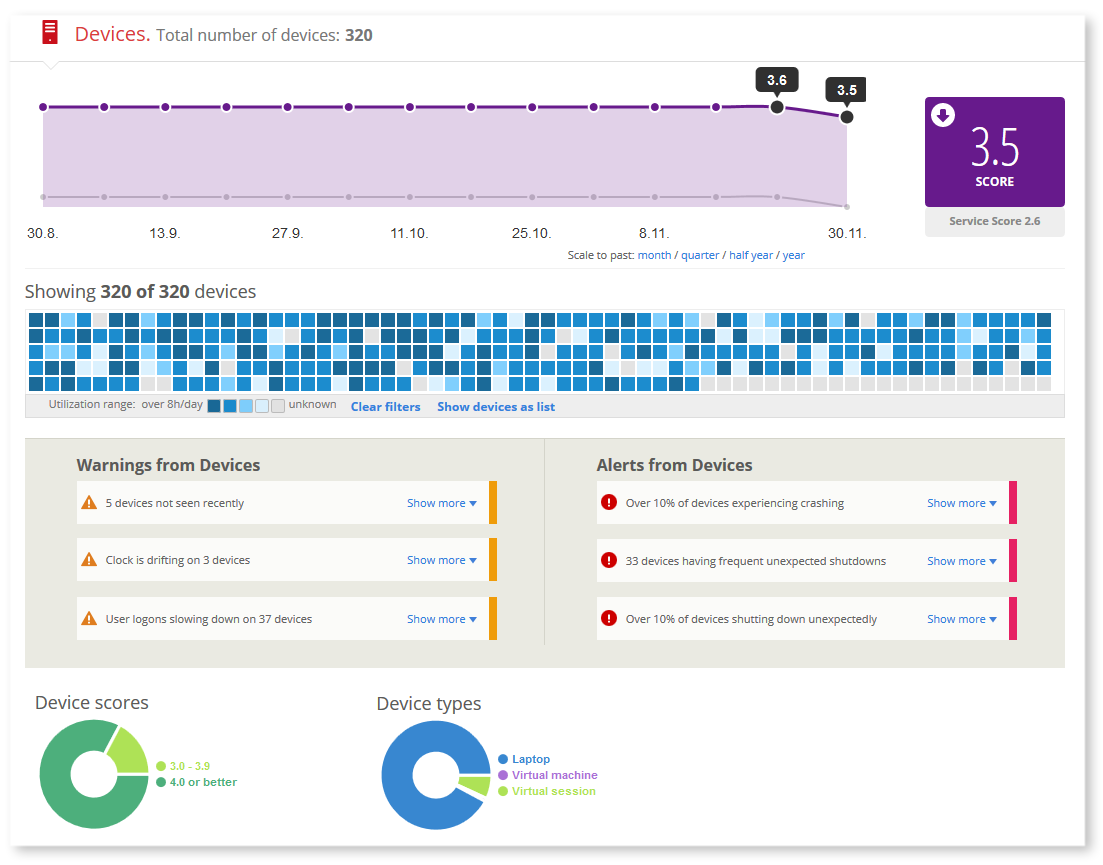
Example: Performance report shows relations between infrastructure health score and performance of individual devices
Here are some use cases of diagnostic analytics:
- Root cause analysis. This method helps find the real reasons behind negative events, like defects in manufacturing.
- Drill down. This means digging through layers of details to find the reasons behind an event. For example, a retailer might use drill-down to discover low inventory levels due to increased sales in a specific region.
- Regression analysis. You can find trends and connections between variables to predict future outcomes. It involves assumptions about irregular behavior and relationships between events.
Predictive analytics
Predictive analytics anticipates possible events using the data received from descriptive and diagnostic analysis. However, accuracy hinges on data quality and stability, requiring careful handling and ongoing optimization.
Following our example, a hospital could use this type of data analytics to forecast patient admissions. The model could incorporate factors such as historical admission data, weather conditions, public events, and epidemiological data.
Predictive analytics answers the question “What is likely to happen?” helping you make proactive decisions based on data.
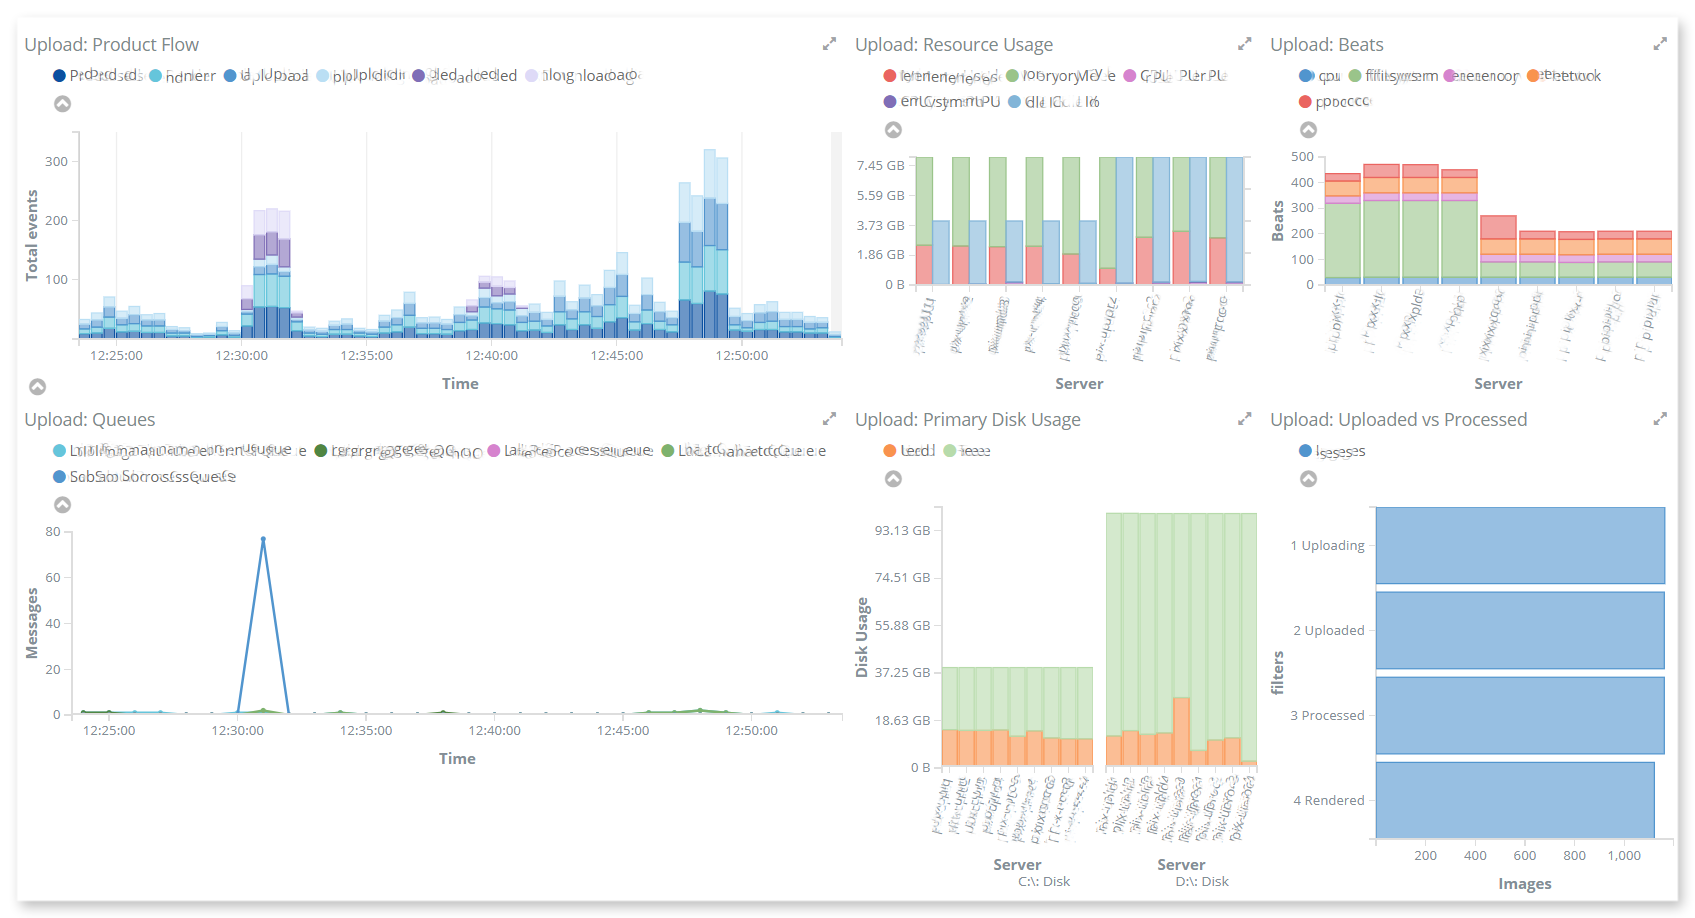
Example: Production line monitoring shows peak workload and helps predict increasing load in the future
Here are instances of predictive analytics in business:
- Performance and resource usage optimization. Predictive analytics helps optimize maintenance based on performance insights and wear and tear monitoring.
- Product pricing. Retailers can decide on the best price for a product or service by understanding the underlying demand.
- Sales forecasting. Precisely predict product demand at the store level over time. This helps with inventory, preventing stockouts, pricing adjustments, and supply chain management.
Prescriptive analytics
Prescriptive analytics combines big data, math, business rules, and Machine Learning to predict and suggest decisions. It not only anticipates what and when but also explains why.
This type recommends actions to prevent future issues or capitalize on opportunities. For example, the same hospital could use it to predict resource demands and staff availability, effectively allocating resources to cope with the most challenging conditions with ease.
It answers the question “What should we do?” and helps optimize decision-making for desired results.
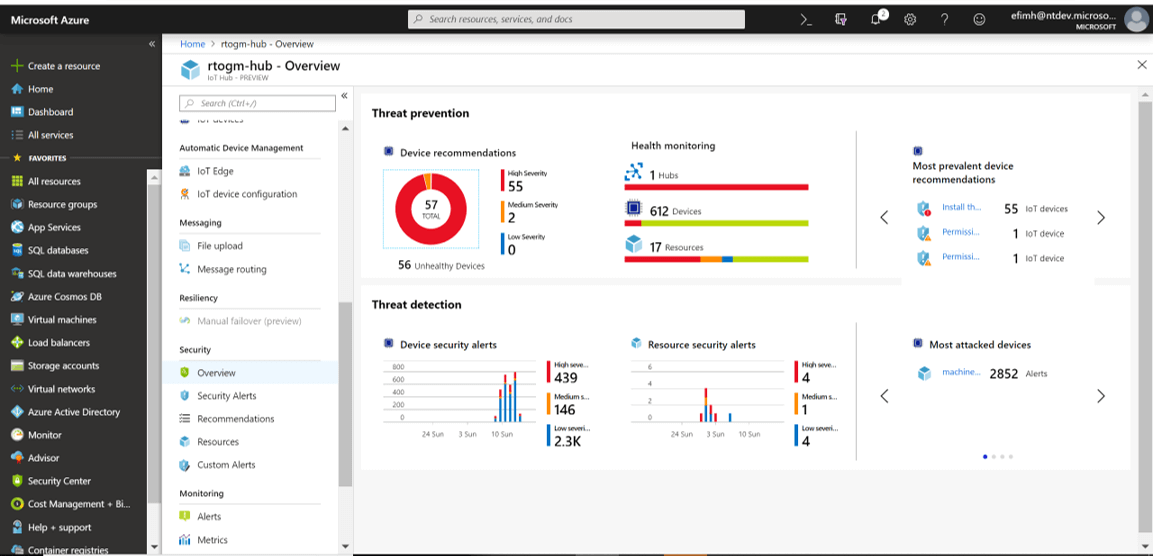
Example: Device recommendations for threat prevention on device management dashboard. Image credit: azure.microsoft.com
Prescriptive analytics finds uses in various business applications:
- Supply chain optimization. In supply chain management, it simplifies decisions on inventory, production schedules, and transportation routes.
- Fraud prevention. For financial institutions, prescriptive analysis studies past data to spot patterns indicating fraud in transactions.
- Error or malfunction alerts. Manufacturers use prescriptive analytics to proactively respond to potential threats and detect malfunction risks before they happen, preventing production halts and serious financial loss.
As we’ve already mentioned, some data science experts also specify cognitive analytics, among other kinds of data analysis. Cognitive analytics uses AI and Machine Learning to understand complex data like text, images, or audio. It helps find insights and predictions from multiple data formats. For example, in customer service, it can analyze feedback to make experiences better. It’s also handy for retail and market research.
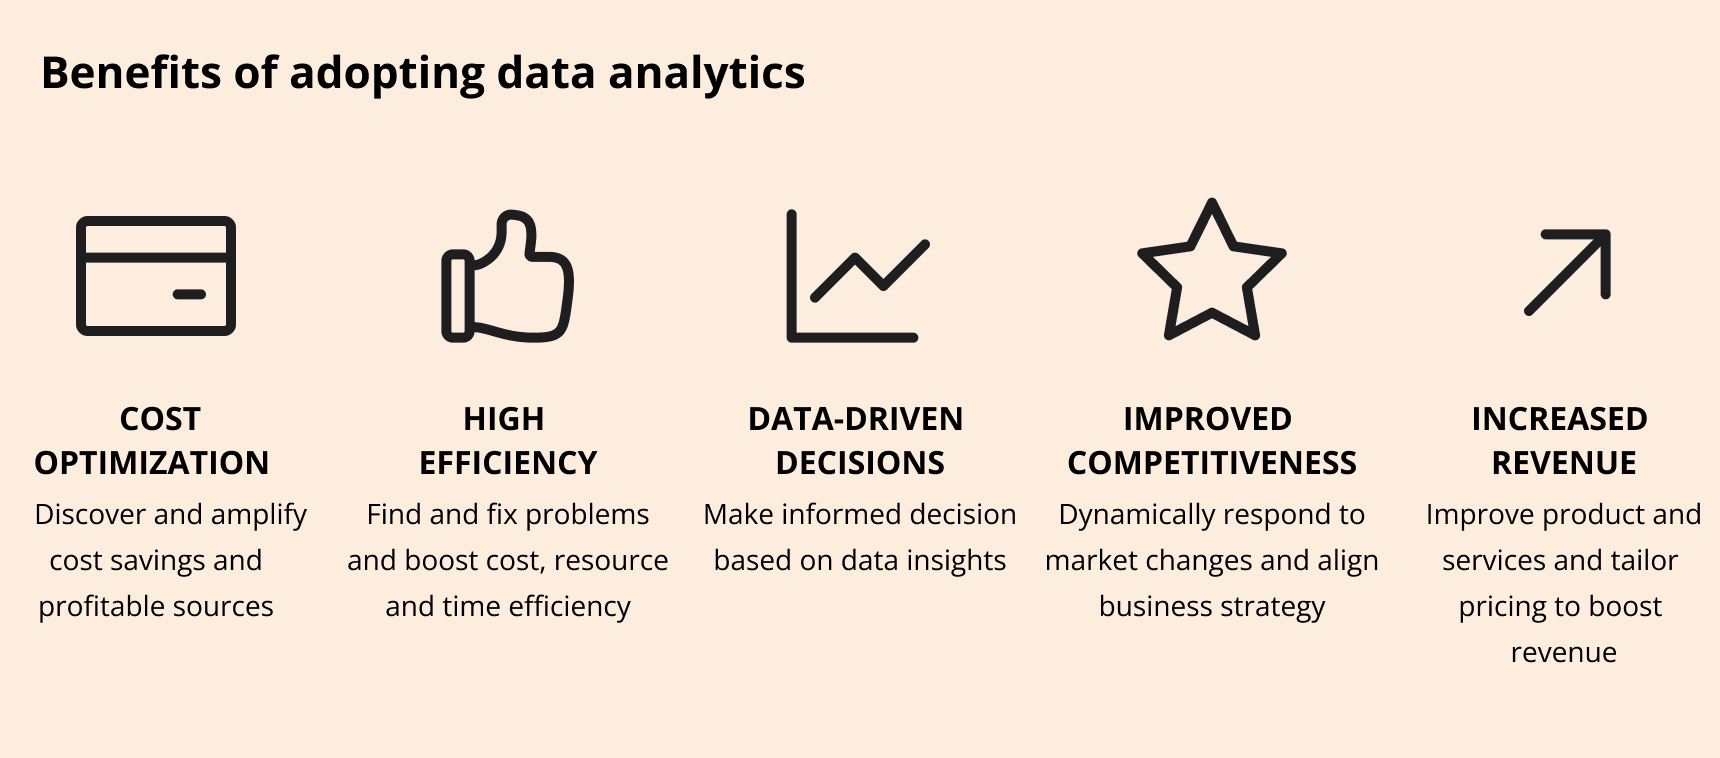
All kinds of businesses, from startups to large enterprises, can benefit from data analytics implementation. Whether it’s eCommerce, healthcare, finance, or manufacturing, data insights are invaluable. Let’s overview the role of data analytics and see how you can benefit from implementing it into your strategy.
Cost optimization
Using your company’s data can help cut costs and run things more smoothly. For instance, a freight company can use data to see whether a certain route is profitable. By stopping shipments on the ineffective route, they can save and relocate funds to promising ones.
Efficiency
Data analysis can spot where a company isn’t working to the fullest. Collecting and analyzing data sets helps find weaknesses in how a business operates. Fixing these inefficiencies is crucial as they can significantly drain profits.
Data-driven decision making
Data analysis is a game-changer for decision-making. It helps predict what customers want and understand past and future trends. This is how companies like Netflix choose shows to produce — not on the hunch, but using the actual data on their viewers.
Improved competitiveness
Data analysis lets businesses understand customers better and improve their strategies, making them more competitive. Regularly gathering data, small companies can react faster to changing trends than large corporations, competing even with market giants.
Increased revenue
Data analysis boosts revenue by guiding pricing and product strategy. For instance, if data shows customers often buy two products together, bundling them at a lower price can bring in more money.
Turn data into your competitive advantage
Leverage different types of data analytics to become the most profitable and efficient business in your niche.
Show data analytics servicesTo find out the most widely used type of data analytics, let’s look at some numbers. But you should remember that the numbers can significantly vary depending on your industry; we provide the average picture for the data analytics use.
In the Global Data and Analytics Survey, more than 2,000 executives were asked about their company’s decision-making process. The results showed that descriptive analytics with more than 58% is still the most accepted method for data-driven decisions. Diagnostic and predictive analytics are also pretty popular, with 34% and 36% of respondents claiming they use them to gain insights for future outcomes. Prescriptive and cognitive analytics are somewhat less popular than other types, but they are becoming more trending with the advancements in AI and Machine Learning.
Now that we understand the importance of data analytics, let’s review what type (or a combination) you should choose for your company. Here are factors you should consider.
Business goals
Depending on the goals your company is planning to achieve, you can use descriptive analysis for strategic planning or predictive analysis for forecasting future outcomes. Prescriptive analysis will give you actionable recommendations on how to achieve your goals.
Time
Descriptive analysis is very useful for short-term insights, predictive for midterm, and prescriptive is better used in the long run.
Complexity of analysis
If you only require simple summaries, descriptive analysis will be enough. However, if you need in-depth insights and root cause analysis, then you should consider other types of data analytics.
Industry best practices
Research what data analysis kinds are used in your industry or similar industries. Industries that heavily rely on data, like eCommerce, usually implement all the data analytics types at once to make decisions based on data and better cater to their customers’ needs.
Transform your raw data into business-critical insights with our rich experience in data application development. Our team has over 14 years of experience working with various types of data and helping companies in logistics, retail, healthcare, media, agriculture, and publishing get the best of their data assets. We build data analytics solutions, visualize and manage data, set up and support complex data pipelines and infrastructures, and provide data engineering and consulting services.
Among our flagship data projects are:
- Development and support of an AWS-based data-driven solution for Diaceutics (UK), a global leader in diagnostic data analytics and services. The system includes myriad customizable data pipelines and data analytics tools that process healthcare data from various sources and fuel precision medicine projects. 13 engineers, including data engineers, frontend, backend, DevOps and QA, participated in the project and helped Diaceutics release a working solution in the record 8-month term while keeping the project on budget. Read the full success story…
- Design and development of an IoT energy monitoring platform for an award-winning US company in the energy management and storage sector. The platform includes a distributed scalable infrastructure, real-time data analytics and visualization tools, and cross-platform mobile and web applications. Read the full success story…
- Integration of big data management, analytics and visualization tools into a media streaming platform for Feed Media Group (US). Based on a combination of Elastic Stack solutions, new data analytics features helped the company and its clients gain visibility into customer experiences, monitor and optimize conversions, and make data-driven decisions on how to better allocate budget and resources to boost revenue. Read the full success story…
Make sense of your data with the right data analytics tools
We will help you choose and integrate data analytics capabilities that fit your goals, infrastructure, and budget.
HIRE DATA ENGINEERS


